Intuitive DataViz solution displaying graph oriented data using d3js
The project being just a front-end HTML page using mainly D3js and other Javascript libraries, there is no need to install anything.
However, to be able to import data into the page, you need to host it on a server.
We recommend you using Visual Studio Code and installing the Live Server extension. In one click the extension will launch a server (if not taken, on the port 5500) and you'll be able to see the index.html on your web browser using the address http://127.0.0.1:{Port used by Live Server}/index.html .
Alternatively, you can easily set up a server using NodeJS, installable with NPM. We recommend you looking it up if you don't want to use Visual Studio Code.
When going on index.html, you will be welcomed with a blank page. You can use the footer to import the database of your choice to display the data.
For now, our solution uses a JSON database that has a graph type format which has the root node and its children stored in it. You can use one of our 2 mock databases stored in the db file. These 2 examples are based on what files a person working in a hospital could have in his computer.

- On the left side of the footer, you can choose in which view you want to display the data


-
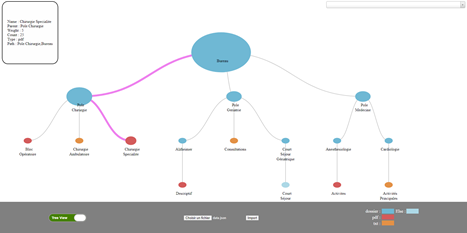
When putting your mouse on a node, it will highlight its path and display the node's data on the top left panel
-
The search bar contains all the node's names. Clicking on one of them will expand the tree if the corresponding node is collapsed and will higlight the node's path and display its information.


-
In the circles' view, hovering with the mouse on a circle will display its data on the top left corner and clicking on a circle will zoom on it and show its children


