


Following the recent report by Dasenbrock-Gammon et al. [Nature 615, 244–250 (2023)] of near-ambient superconductivity in nitrogen-doped lutetium trihydride (LuH3−δNε), significant debate has emerged surrounding the composition and interpretation of the observed sharp resistance drop. Here, we meticulously revisit these claims through comprehensive characterization and investigations. We definitively identify the reported material as lutetium dihydride (LuH2), resolving the ambiguity surrounding its composition. Under similar conditions (270–295 K and 1–2 GPa), we replicate the reported sharp decrease in electrical resistance with a 30% success rate, aligning with the observations by Dasenbrock-Gammon et al. However, our extensive investigations reveal this phenomenon to be a novel pressure-induced metal-to-metal transition intrinsic to LuH2, distinct from superconductivity. Intriguingly, nitrogen doping exerts minimal impact on this transition. Our work not only elucidates the fundamental properties of LuH2 and LuH3, but also critically challenges the notion of superconductivity in these lutetium hydride systems. These findings pave the way for future research on lutetium hydride systems, while emphasizing the crucial importance of rigorous verification in claims of ambient-temperature superconductivity.
I. INTRODUCTION
The 1911 discovery of superconductivity in mercury at 4.2 K, characterized by its vanishing electrical resistance, opened a pivotal chapter in condensed matter physics.1 This ignited an ongoing quest for materials exhibiting higher transition temperatures Tc, a crucial factor for potential breakthroughs in critical technologies like energy transmission and transportation. The subsequent emergence of cuprate superconductors2,3 boasting Tc values above the boiling point of liquid nitrogen (77.4 K) represented a significant leap forward. More recently, certain hydrides have also gained attention for displaying superconductivity above 200 K, albeit under extreme pressures exceeding 100 GPa.4–10
In 2023, a particularly captivating yet controversial claim captured global attention. Dasenbrock-Gammon et al.11 reported the tantalizing observation of potential near-room-temperature superconductivity in a lutetium–hydrogen–nitrogen (Lu–H–N) compound at 294 K under modest pressure (1 GPa). Although this paper was retracted subsequently,12 reports emerged that superconductivity in this compound had been independently reproduced.13 Despite this, skepticism persists due to unresolved questions about the precise composition of the compound and the authenticity of the reported decrease in eletrical resistance. Further experimental verification and a deeper understanding of the underlying mechanisms are crucial to elucidating whether this preliminary study genuinely achieves the long-sought goal of ambient-temperature superconductivity.
A significant controversy surrounds the composition of the proposed Lu–N–H compound. Dasenbrock-Gammon et al. propose that this phase is the nitrogen-doped trihydride LuH3−δN, attributing the observed blue-to-pink color transition and superconductivity to this compound. However, their claim contradicts established knowledge, which associates such color changes with the face-centered cubic (fcc) phase present in the dihydride LuH2.14–22 While theoretical models suggest the possibility of nitrogen-doped fcc LuH3 mimicking LuH2,23–30 experimental evidence demonstrates that LuH3 maintains its trigonal symmetry at pressures below 10 GPa.31 Unfortunately, challenges in accurately quantifying hydrogen content hinder researchers’ efforts to accurately determine the composition of the reported superconducting phase.
More importantly, the claimed near-ambient superconductivity of LuH3−δNδ at 294 K and 1 GPa remains unconfirmed by independent studies, casting doubt on its reality. Despite claims of a 35% replication success rate, subsequent investigations have failed to replicate these findings.14–19,32–35 While some studies have observed a similar drop in electrical resistance, alternative explanations, including metal–insulator transitions33 or percolative phenomena,35 have been proposed. These controversies highlight the crucial need for meticulous compositional analysis and rigorous validation before accepting any claim of superconductivity in this material.
To comprehensively investigate the controversial findings of Dasenbrock-Gammon et al., we meticulously replicated their synthesis protocol, exposing high-purity lutetium foil to a precisely calibrated 99:1 H2:N2 gas mixture under identical conditions of 2 GPa, 65 °C, and 24 h.11 Recognizing the inherent difficulty in differentiating between fcc LuH2 and LuH3 phases, we employed a separate strategy: synthesizing nitrogen-doped variants of both materials. We independently treated both LuH2 and LuH3 with nitrogen gas at 2 GPa for varying durations (1–5 days) at an elevated temperature of 200 °C to enhance the reaction kinetics. This approach enabled independent investigations of each material’s properties, culminating in a comprehensive comparative analysis that clearly distinguished their unique characteristics.
Our comprehensive investigation, employing a combination of advanced analytical techniques including optical microscopy, x-ray diffraction (XRD), Raman spectroscopy, and electrical resistance measurements,36 yielded results significantly divergent from those of Dasenbrock-Gammon et al.11 We observed that lutetium metal remains largely unchanged under the prescribed H2:N2 gas mixture conditions of 2 GPa, 65 °C, and 24 h.11 Importantly, nitrogen-doped LuH3 retained its insulating, gray, and trigonal characteristics even under pressures exceeding 10 GPa. These findings offer compelling evidence that both the fcc metallic phase and the blue-to-pink color changes previously attributed to LuH3−δNε are inherent to LuH2.
Crucially, electrical resistance measurements on both nitrogen-doped and undoped LuH2 samples revealed a significant drop at 270–295 K and 1–2 GPa, with a success rate of 30%, consistent with observations by Dasenbrock-Gammon et al. However, our further experiments indicate that this reduction corresponds to a metal-to-metal phase transition rather than superconductivity. Consequently, we assert that the observed decrease in electrical resistance is more accurately attributed to a metal-to-metal transition in LuH2, rather than being indicative of superconductivity in LuH3−δNε. Further details are provided in the subsequent sections.
II. REPRODUCIBILITY OF THE PUBLISHED PROTOCOL
Figures 1(a) and 1(b) illustrate characterization results obtained by meticulously adhering to the original synthesis protocol outlined by Dasenbrock-Gammon et al. Unexpectedly, lutetium metal chips approximately seven μm thick retain their original color even when exposed to a 99:1 H2:N2 gas mixture at pressures exceeding 3.0 GPa.
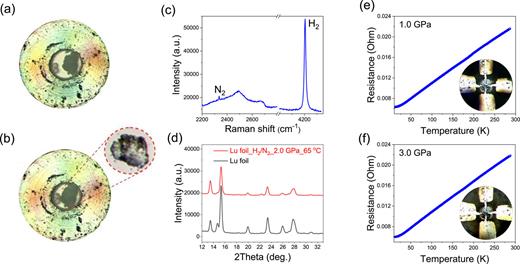
Synthesis and characterization of Lu metal under a H2:N2 (99:1) gas mixture following established protocol. (a) Pre-heating phase of the lutetium sample at 2.0 GPa with a 99% H2 and 1% N2 gas mixture at 1.0 GPa. (b) Post-heating phase for the same sample, maintained at 65 °C and 2.0 GPa for 24 h, conspicuously devoid of the blue hue reported by Dasenbrock-Gammon et al. (c) Raman spectrum of the gas mixture in contact with the lutetium sample. (d) XRD patterns for pure lutetium metal compared with the sample post 24-h heating at 65 °C and 2.0 GPa. (e) Resistance variations with temperature for the sample post-heating at 1.0 GPa. (f) Resistance variations with temperature for the sample post-heating at 3.0 GPa.
Synthesis and characterization of Lu metal under a H2:N2 (99:1) gas mixture following established protocol. (a) Pre-heating phase of the lutetium sample at 2.0 GPa with a 99% H2 and 1% N2 gas mixture at 1.0 GPa. (b) Post-heating phase for the same sample, maintained at 65 °C and 2.0 GPa for 24 h, conspicuously devoid of the blue hue reported by Dasenbrock-Gammon et al. (c) Raman spectrum of the gas mixture in contact with the lutetium sample. (d) XRD patterns for pure lutetium metal compared with the sample post 24-h heating at 65 °C and 2.0 GPa. (e) Resistance variations with temperature for the sample post-heating at 1.0 GPa. (f) Resistance variations with temperature for the sample post-heating at 3.0 GPa.
XRD analyses, presented in Fig. 1(d), reveal the dominant presence of unreacted lutetium metal, contradicting the anticipated formation of a blue, nitrogen-doped lutetium hydride phase. Additionally, high-pressure electrical resistance profiles, shown in Figs. 1(e) and 1(f), exhibit a typical metallic behavior characterized by a linear temperature dependence above 50 K, thus challenging previous claims of superconducting phase transitions in nitrogen-doped lutetium hydrides.
III. COLOR AND STRUCTURE OF NITROGEN-DOPED LuH3
LuH3 exhibits trigonal symmetry under ambient conditions and transitions to a cubic phase above 10 GPa.31 While Dasenbrock-Gammon et al. proposed that trace nitrogen might stabilize this cubic metallic LuH3 phase below 2 GPa and 65 °C, this proposition has not yet been experimentally confirmed.
To investigate this, we conducted experiments exposing LuH3 to N2 gas for 24 h at 2.0 GPa and 200.0 °C [Fig. 2(a)]. Notably, the temperature was elevated by 135 °C compared with the 65 °C used by Dasenbrock-Gammon et al. to further enhance reaction kinetics. Even at elevated pressures exceeding 30.2 GPa, the intrinsic dark gray hue of LuH3 remains unchanged [Figs. 2(b) and S1 (supplementary material)]. XRD and Raman spectroscopic analyses [Figs. 2(c) and 2(d)] corroborate that the crystalline lattice largely retains its initial trigonal symmetry after heat treatment at 2 GPa. Furthermore, the electrical resistance of nitrogen-doped LuH3 remains within a consistent range of 105–107 Ω up to pressures approaching 9.3 GPa [Figs. 2(e) and 2(f)], providing further confirmation of its intrinsic insulating behavior. Increasing the reaction time between LuH3 and N2 gas to five days did not lead to any noticeable changes.
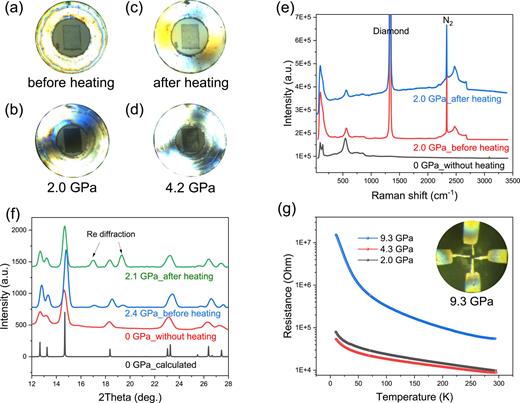
Characterization of nitrogen-doped LuH3 synthesized at 200 °C and 2.0 GPa for 24 h. (a)–(d) Sequential images documenting the sample’s color evolution during synthesis, with no observed blue-to-pink color changes. (e) Comparative Raman spectra of LuH3 before and after pressurized heating; the undoped LuH3 spectrum is included for reference. (f) XRD patterns of LuH3 pre- and post-heating, complemented by the undoped LuH3 pattern at 0 GPa and a simulated LuH3 pattern. (g) Resistance as a function of temperature for nitrogen-doped LuH3 at pressures from 2.0 to 9.3 GPa. The inset illustrates the four-probe measurement.
Characterization of nitrogen-doped LuH3 synthesized at 200 °C and 2.0 GPa for 24 h. (a)–(d) Sequential images documenting the sample’s color evolution during synthesis, with no observed blue-to-pink color changes. (e) Comparative Raman spectra of LuH3 before and after pressurized heating; the undoped LuH3 spectrum is included for reference. (f) XRD patterns of LuH3 pre- and post-heating, complemented by the undoped LuH3 pattern at 0 GPa and a simulated LuH3 pattern. (g) Resistance as a function of temperature for nitrogen-doped LuH3 at pressures from 2.0 to 9.3 GPa. The inset illustrates the four-probe measurement.
These data collectively cast doubt on the hypothesis that trace nitrogen quantities could stabilize a metallic fcc LuH3−δNε phase, which was purported to undergo a color change from blue to pink at pressures exceeding 0.3 GPa.11
IV. COMPOSITION OF REPORTED COMPOUND: LuH3 OR LuH2
Figure 3 explores the influence of nitrogen on LuH2 under consistent experimental conditions. Notably, the pressurized nitrogen-doped LuH2 exhibits a striking color change from blue to pink or red [Figs. 3(a) and S2 (supplementary material)]. Single-crystal XRD and Raman spectroscopy [Figs. 3(b) and 3(c)] confirm the stabilization of this phase into a fcc structure. This fcc structure exhibits a lattice parameter of 5.0378 Å, compared with the pristine LuH2 sample’s 5.0235 Å. This lattice expansion suggests the incorporation of nitrogen atoms into the crystal lattice. In addition, electrical resistance measurements [Fig. 3(d)] reveal a conventional metallic state in nitrogen-doped LuH2 at 0.4 GPa, without significant variations. This pressure is considerably lower than the 1 GPa reported for superconductivity.11 These results indicate that the structure and properties of nitrogen-doped LuH2 closely resemble those of pristine LuH2.14,37

Characterization of nitrogen-doped LuH2 produced from single-crystal LuH2 treated in N2 gas at 200 °C and 2.0 GPa. (a) Sequential photographs capturing the sample’s color evolution as the pressure ranges from 0 to 20.0 GPa. (b) XRD patterns of both undoped and nitrogen-doped LuH2 single crystals. (c) Raman spectra of LuH2 pre- and post-heat treatment. (d) Electrical transport behavior of nitrogen-doped LuH2 powders under 0.4 GPa.
Characterization of nitrogen-doped LuH2 produced from single-crystal LuH2 treated in N2 gas at 200 °C and 2.0 GPa. (a) Sequential photographs capturing the sample’s color evolution as the pressure ranges from 0 to 20.0 GPa. (b) XRD patterns of both undoped and nitrogen-doped LuH2 single crystals. (c) Raman spectra of LuH2 pre- and post-heat treatment. (d) Electrical transport behavior of nitrogen-doped LuH2 powders under 0.4 GPa.
Our comprehensive data demonstrate that nitrogen-doped LuH2 adopts an fcc structure, undergoes pressure-induced color changes, and exhibits metallic behavior at low pressures. In stark contrast, nitrogen-doped LuH3 retains its native trigonal lattice and lacks corresponding color changes and metallic behavior. Comparative analysis [Figs. 4(a)–4(f)] reveals a striking consistency between the structure and vibrational properties of the Lu–H–N compound reported by Dasenbrock-Gammon et al. and those of fcc-structured LuH2. This compelling evidence suggests that the reported Lu–N–H compound is LuH2 rather than LuH3. Furthermore, our investigation reveals minimal influence of nitrogen doping on both LuH2 and LuH3, further supporting this conclusion.
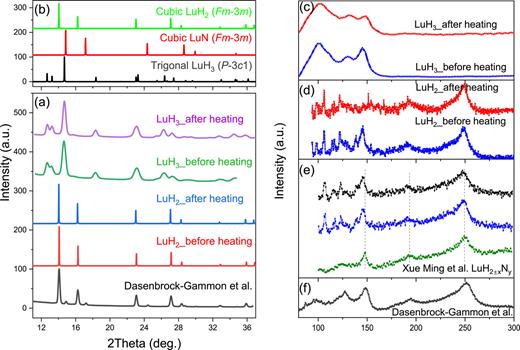
Detailed comparison of structure and properties of LuH2 and LuH3. (a) XRD patterns of LuH2 and LuH3 before and after heating, along with the diffraction pattern of the Lu–N–H compound. (b) Simulated XRD patterns of LuH2 (), LuN (), and LuH3 (). (c) Raman spectra of LuH3 before and after heating. (d) Raman spectra of LuH2 before and after heating. (e) Raman spectra of as-synthesized LuH2±xNy compounds from Ming et al.19 (f) Raman spectrum of the Lu–H–N compound.11
Detailed comparison of structure and properties of LuH2 and LuH3. (a) XRD patterns of LuH2 and LuH3 before and after heating, along with the diffraction pattern of the Lu–N–H compound. (b) Simulated XRD patterns of LuH2 (), LuN (), and LuH3 (). (c) Raman spectra of LuH3 before and after heating. (d) Raman spectra of LuH2 before and after heating. (e) Raman spectra of as-synthesized LuH2±xNy compounds from Ming et al.19 (f) Raman spectrum of the Lu–H–N compound.11
V. NATURE OF THE REPORTED SHARP DROP IN ELECTRICAL RESISTANCE
Across various LuH2 samples, including nitrogen-doped, undoped, polycrystalline, and single-crystal forms, Figs. 5(a)–5(c) demonstrate a sharp decrease in electrical resistance with decreasing temperature. This occurs within a temperature range of 270–295 K and pressures between 1 and 2 GPa, without altering the crystal structures. Importantly, the transition temperature, pressure, and rate of resistance reduction align with the 294 K and 1 GPa results reported by Dasenbrock-Gammon et al. [Fig. 5(d)]. However, zero resistance is not achieved.
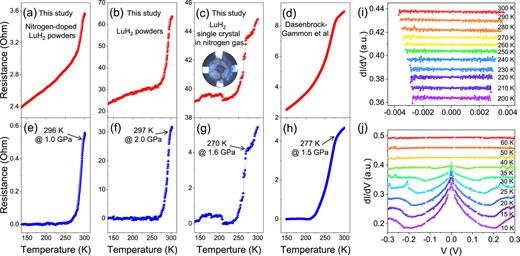
Comparative electrical resistance measurements of nitrogen-doped and pristine LuH2 in various forms and under pressures in the range 1–2 GPa. (a) Electrical resistance of nitrogen-doped polycrystalline LuH2, illustrating a drop at 296 K and 1.0 GPa. (b) Electrical resistance of pristine polycrystalline LuH2, showing a drop at 297 K and 2.0 GPa. (c) Electrical resistance of single-crystal LuH2 in nitrogen gas, indicating a drop at 270 K and 1.6 GPa. The inset shows an optical photograph of the four-probe electrical resistance setup in a DAC. (d) Data from Dasenbrock-Gammon et al., exhibiting a resistance drop at 296 K and 1.0 GPa. (e)–(h) Resistance profiles after background subtraction, following the methodology of Dasenbrock-Gammon et al. (i) Andreev reflection measurements from single-crystal LuH2 under 1.6 GPa in nitrogen (j) Andreev reflection measurements from standard MgB2 for comparison, conducted under identical experimental conditions.
Comparative electrical resistance measurements of nitrogen-doped and pristine LuH2 in various forms and under pressures in the range 1–2 GPa. (a) Electrical resistance of nitrogen-doped polycrystalline LuH2, illustrating a drop at 296 K and 1.0 GPa. (b) Electrical resistance of pristine polycrystalline LuH2, showing a drop at 297 K and 2.0 GPa. (c) Electrical resistance of single-crystal LuH2 in nitrogen gas, indicating a drop at 270 K and 1.6 GPa. The inset shows an optical photograph of the four-probe electrical resistance setup in a DAC. (d) Data from Dasenbrock-Gammon et al., exhibiting a resistance drop at 296 K and 1.0 GPa. (e)–(h) Resistance profiles after background subtraction, following the methodology of Dasenbrock-Gammon et al. (i) Andreev reflection measurements from single-crystal LuH2 under 1.6 GPa in nitrogen (j) Andreev reflection measurements from standard MgB2 for comparison, conducted under identical experimental conditions.
When the background subtraction approach of Dasenbrock-Gammon et al. is employed, our data in Figs. 5(e)–5(g) seemingly indicate zero resistance, hinting at potential superconductivity in line with their study. Interestingly, around 30% of our LuH2 samples exhibit this resistance decrease, similar to the 35% previously reported by Dasenbrock-Gammon et al. Although successful replication has been limited, the consistency of pressure and temperature conditions associated with the resistance drop across independent experiments in two different laboratories offers compelling evidence that this phenomenon reflects an electronic phase transition.
In our exploration of potential superconductivity in nitrogen-doped LuH2, we employed Andreev reflection38,39 [Figs. 5(i) and 5(j)] as a diagnostic method, in line with established protocols.11 This quantum mechanism enables electrons from a normal metal to pair as Cooper pairs and cross into a superconductor, typically signaling the presence of superconducting states. While Andreev reflection is prominently observable in established superconductors such as MgB2, our experiments with nitrogen-doped LuH2 did not reveal any distinct Andreev reflection signatures.
It is crucial to understand that the absence of clear Andreev reflection indicators does not definitively preclude the existence of superconductivity. The reliability of Andreev reflection for diagnosing superconductivity is heavily influenced by the characteristics of the tunneling barrier at the superconductor–normal metal interface. Although the lack of Andreev reflection alone does not conclusively dismiss the possibility of superconductivity, our comprehensive observations, including the absence of zero resistance, strongly imply that the reduction in electrical resistance observed in nitrogen-doped LuH2 is not characteristic of superconducting behavior.
Previous studies have reported that mechanical grinding of polycrystalline LuH2 under ambient conditions can lead to metal-to-insulator transitions33 and percolation35—the abrupt transition from a nonconducting to a conducting state upon reaching a critical density of conductive elements. This phenomenon is typically associated with inhomogeneous systems like polycrystalline or granular materials. By contrast, our data reveal a distinct drop in electrical resistance in single-crystal LuH2 samples within the temperature and pressure ranges 270–295 K and 1–2 GPa. This signifies a metal-to-metal electronic transition rather than a transition to an insulator.
It is well established that achieving true stoichiometric fcc LuH2 is challenging. Hydrogen vacancies often form during synthesis, resulting in non–stoichiometric LuH2+x compounds. These vacancies significantly impact resistivity and optical properties while leaving the overall crystal structure largely unchanged. This behavior is characteristic of rare-earth metal hydrides and has been extensively studied in materials like “switchable mirrors”40–46 that switch between transparent insulating and reflective metallic states.
Therefore, the metal-to-metal electronic transition observed in our study likely arises from alterations in hydrogen–lutetium interactions influenced by factors such as pressure, strain/stress, temperature, and the spatial distribution of hydrogen vacancies. These external variables could explain the 30%–35% replication rate observed. Additionally, our investigation revealed that nitrogen doping has a negligible impact on the observed metal-to-metal transition. Encapsulating a single-crystal of LuH2 in a nitrogen atmosphere within a diamond anvil cell (DAC) at 1–2 GPa for five days resulted in no observable changes in electrical resistance.
In summary, our research refutes claims of near-ambient-condition superconductivity in nitrogen-doped LuH3−δNε. Data show that features attributed to LuH3−δNε are intrinsic to LuH2, including the metallic fcc phase and pressure-induced color changes. We successfully replicated the resistance drop in LuH2 under comparable conditions with a similar success rate to Dasenbrock-Gammon et al. However, our extensive investigations reveal this phenomenon to be a novel pressure-induced metal-to-metal transition intrinsic to LuH2, distinct from superconductivity. Additionally, nitrogen minimally impacts this transition.
VI. METHODS
A. Synthesis of Lu–H–N samples
Considering that commercially available Lu metal foils often contain LuH2 and Lu2O3, we used XRD to rigorously select the purest foils based on their diffraction patterns. All samples were handled within a glovebox and prepared with gas in a pre-purged, hydrogen-rich environment, following the procedures detailed in the original report by Dasenbrock-Gammon et al.11 The conditions within the glovebox were controlled to ensure that O2 and H2O levels were consistently below 0.5 ppm. Subsequently, we heated the sample overnight in an oven at 65 °C, and after 24 h, we opened the DAC to retrieve the sample.
We also used commercially available cubic LuH2 single crystals as precursors to synthesize nitrogen-doped LuH2. Before loading with nitrogen gas, we performed a single-crystal XRD measurement to assess its quality. Several high-purity LuH2 crystals were placed into a DAC, loaded with nitrogen gas, and subjected to pressure increase up to 2.0 GPa. The DAC was then kept in an oven at 200 °C for 24 h. Once the heat treatment concluded, single crystals were removed for further measurements. The synthesis procedure for nitrogen-doped LuH3 was identical to that for LuH2, using commercially available LuH3 powders as precursors, loaded into a DAC, pressurized to 2.0 GPa, and kept in an oven at 200 °C for 24 h.
B. Single-crystal and powder XRD measurements
Powder and single-crystal XRD measurements were conducted on a Bruker D8 Venture diffractometer utilizing Mo Kα radiation. We collected the powder XRD rings of Lu foil and LuH3 powders, both pre- and post-heating, using a charge-coupled device detector. These data were then integrated into XRD patterns with the assistance of APEX3 software. For the high-pressure powder XRD measurements of LuH3, both pre- and post-heating, samples were prepared in SC-type DACs with rhenium gaskets. We calibrated the distance and tilt of the detector using CeO2 powder. For LuH2 and nitrogen-doped LuH2, appropriate single crystals were selected for data collection, which was conducted at room temperature. The crystal structures of LuH2, both pre- and post-heating, were solved and refined using the APEX3 software.
C. Raman spectroscopy measurements
Raman spectra of Lu, LuH2, LuH3, and corresponding reactants were obtained using an S&I MonoVista CRS + Raman system. The 532 nm laser was utilized for the excitation, the laser power ranged from 1.148 to 4.572 mW, and 300 or 2400 gratings/mm were employed during the measurements. The Raman system was calibrated with single-crystal silicon (520 cm−1) before measurements were performed.
D. High-pressure electrical transport and Andreev reflection measurements
The resistance of the as-synthesized samples under high pressure was measured using the Van der Pauw method in BeCu alloy symmetric DACs with a culet size of 300 μm. For each electrical transport measurement, a pre-pressed and drilled Re gasket insulated by cBN/epoxy mixtures was employed, creating a hole with a diameter of 100 μm. Nitrogen gas and NaCl powder were used as pressure-transmitting media. Four Pt strips served as conductive wires, with ruby functioning as the pressure marker. Temperature-dependent resistance measurements were conducted on an electrical transport system, equipped with a Keithley 6221 current source, a 2182A nanovoltmeter, and a 7001 switch device. For high-pressure Andreev reflection measurements, sharp Pt tips were cut to make contact with the sample. Before measuring single-crystal LuH2 in nitrogen, the Andreev reflection experiment on MgB2 was conducted below 60 K using our electrical transport system.
SUPPLEMENTARY MATERIAL
Figure S1. Pressure-dependent color changes of nitrogen-doped LuH3. Figure S2. Pressure-dependent color changes of nitrogen-doped LuH2.
ACKNOWLEDGMENTS
We are grateful to F. Liu and L. Yang for their help with the X-ray diffraction experiments. Y. Ding is also grateful for support from the National Key Research and Development Program of China (Grant Nos. 2022YFA1402301 and 2018YFA0305703) and the National Natural Science Foundation of China (Grant No. U2230401). J. G. Cheng is supported by the National Key R&D Program of China (Grant No. 2021YFA1400200), the National Natural Science Foundation of China (Grant Nos. 12025408 and 11921004), and the Strategic Priority Research Program of CAS (Grant No. XDB33000000).
AUTHOR DECLARATIONS
Conflict of Interest
The authors have no conflicts to disclose.
Author Contributions
Y.D. conceived and designed the experiments. D.W. performed electrical resistance, Raman, and x-ray experiments. N.W., C.Z., C.X., W.G., X.Y., K.B., T.N., J.Z., F.G., P.D., T.M., X.L., L.S., and J.C. all participated in and assisted with the experiments. D.W. and Y.D. analyzed the data. Y.D., D.W., H.-M., and Q.Z. discussed and interpreted the results. Y.D., D.W., and H.-M. wrote the paper.
Dong Wang: Data curation (equal); Formal analysis (equal); Methodology (equal); Software (equal); Validation (equal); Visualization (equal); Writing – original draft (equal); Writing – review & editing (equal). Ningning Wang: Formal analysis (equal); Methodology (equal); Resources (equal); Writing – review & editing (equal). Caoshun Zhang: Formal analysis (equal); Investigation (equal); Methodology (equal); Writing – review & editing (equal). Chunsheng Xia: Formal analysis (equal); Investigation (equal); Writing – review & editing (equal). Weicheng Guo: Formal analysis (equal); Writing – review & editing (equal). Xia Yin: Formal analysis (equal). Writing – review & editing (equal). Kejun Bu: Formal analysis (equal); Methodology (equal); Writing – review & editing (equal). Takeshi Nakagawa: Formal analysis (equal); Writing – review & editing (equal). Jianbo Zhang: Formal analysis (equal); Writing – review & editing (equal). Federico Gorelli: Formal analysis (equal); Methodology (equal); Writing – review & editing (equal). Philip Dalladay-Simpson: Formal analysis (equal); Methodology (equal); Writing – review & editing (equal). Thomas Meier: Formal analysis (equal); Writing – review & editing (equal). Xujie Lü: Formal analysis (equal); Methodology (equal); Writing – review & editing (equal). Liling Sun: Formal analysis (equal); Writing – review & editing (equal). Jinguang Cheng: Formal analysis (equal); Funding acquisition (equal); Methodology (equal); Writing – review & editing (equal). Qiaoshi Zeng: Formal analysis (equal); Investigation (equal); Methodology (equal); Writing – review & editing (equal). Yang Ding: Conceptualization (lead); Data curation (equal); Formal analysis (equal); Funding acquisition (lead); Investigation (lead); Methodology (equal); Project administration (lead); Resources (lead); Software (equal); Supervision (lead); Validation (equal); Visualization (equal); Writing – original draft (lead); Writing – review & editing (lead). Ho-kwang Mao: Formal analysis (equal); Funding acquisition (equal); Investigation (equal); Methodology (equal); Resources (equal); Writing – original draft (equal); Writing – review & editing (equal).
DATA AVAILABILITY
The data that support the findings of this study are available from the corresponding author upon reasonable request.

